When I was a senior in college (longer ago than I should admit to) I did a demonstration about sniffing user’s facebook traffic when they were using wifi at my college. At the time Facebook didn’t redirect HTTP -> HTTPS by default and most users were connecting over plaintext.
Since then Facebook has switched to secure browsing by default, and most companies are encrypting traffic in transit whether it’s internal or external. With that sprawl of encryption it’s can be important to have some understanding of how root signing certificates work, and understand what root certificates your system is trusting. For this post we’ll work with HTTPS clients in Ruby (specifically HTTParty).
When should you care about what your library trusts?
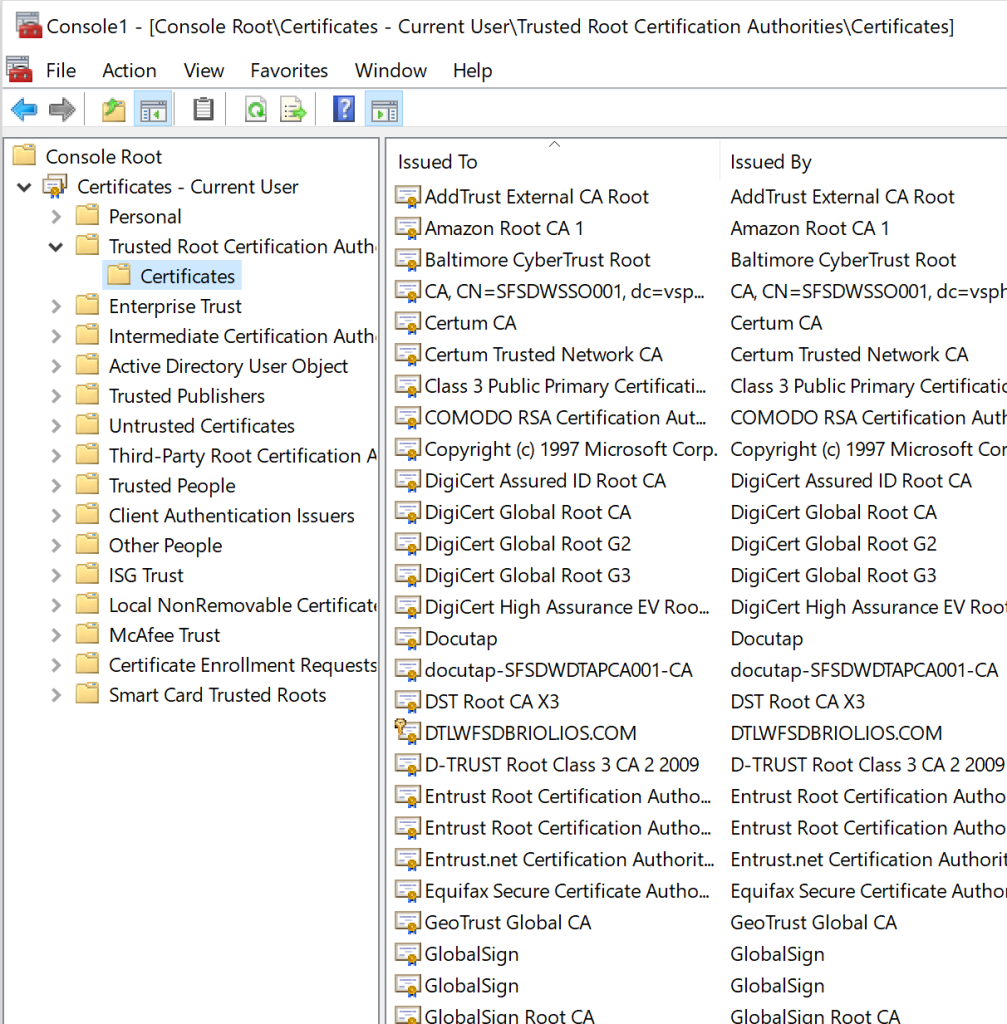
Most of the time you don’t need to worry about it. HTTP libraries and most OS’s come with a default set of public certs they trust. If you’re curious (and on windows) you can check your machine’s listing by running Start -> MMC and adding the certificates snap in for your computer account
It’s a pretty standard list of names you might recognize like DigiCert, GlobalSign, etc. These let your computer trust a normal list of services, and as long as a service takes the time to get a certificate from one of these CA’s you’ll be able to connect to it.
So when should you be worried about what certs your library trusts?
When you might be working with Self Signed certs (like on an internal network)
When you have a very old client that may not have an up to date list
If you’re service is using a newer trust authority like LetsEncrypt
Starting at the top
HTTPary has an initialize method that let’s you set the HTTP scheme (HTTPS/HTTP)
Which lets you decide if you’re going to make a secure or a plaintext request
Finding our defaults
Now that we know we’re going to make a secure request, we need to understand what our library will do by default. There are two methods for setting a CA file, or a CA path
Unfortunately there is no description in the doc of what the library will use by default. That’s not really a knock on the developer, most of the time you don’t have to worry about it.
Plenty of searching in Ruby-doc.org hasn’t shown me what that value is – so when all else fails we can just go take a look. Let’s power up a ruby docker container with
docker run -it ruby /bin/bash
Then we jump into the interactive ruby console by typing irb and importing OpenSSL package by typing require 'openssl'. Lastly we can print what the default cert directory with print(OpenSSL::X509::DEFAULT_CERT_DIR)
And it turns out /us/lib/ssl/certs is a link to /etc/ssl/certs
root@caf6415446ff:/# ls -l /usr/lib/ssl/certs
lrwxrwxrwx 1 root root 14 Oct 12 19:56 /usr/lib/ssl/certs -> /etc/ssl/certs
Which has a ton of certs in it
root@caf6415446ff:/# ls -l /etc/ssl/certs/ | wc -l
258
And there you have it! Now you can comb through the certs in this directory.
Final thoughts
Certs are intimidating when you get started because they seem like magic, and they’re plenty complicated. But at the same time you can abstract some of that complexity away by understanding some basics like when your cert trust store matters.
I went into some detail on finding the default trust store because I think it’s helpful to see that you can make a lot of progress understanding certs just by digging through a repo and looking at source code.
I’m not looking to add to the noise around using zoom to work remotely and connect with people during social distancing, but after spending some time on Google I couldn’t find a guide on how to do this. These are pretty much my own notes while I’m prepping to try and host a user group through zoom.
Here’s my “minimal video call host check list”
Let people know what they’re getting into (state that you’d like people to turn on video in the agenda, tell them what will happen during the meeting, ask for their patience while everyone gets used to the video chat)
Be “that guy” – engage the participants, ask questions, be the energetic one to get the conversation going
A few awkward silences are ok – they happen in real life too
Have fun! We’re all stuck at home, make the best of it
About once a quarter I organize an AWS User Group. We get a group of people together (usually 20 – 30), a sponsor brings pizza, someone spends a few minutes talking about a tech topic, and we nerds get some social time.
With social distancing we cancelled our in person Meetup, but it’s hard to tell how long that will go on, so I’m working on getting some kind of virtual gathering on zoom. Here’s my current plan
Start an open zoom meeting (I have a licensed account from work)
Prevent participants from sharing (Next to screen share click up arrow -> Advanced Sharing Options -> Who can share -> Only Host (this lets cohosts share too)
Let people social network for the first few minutes – I looked into breakout rooms, but I think that’s a different license level
At this point you have a pretty normal zoom meeting where people can chat. Our user groups start with 20 or so minutes of social networking at the beginning. When we’re ready to start the presentation
Make the presenter the cohost (under Manage Participants -> Hover over the name -> Click more -> Click “Make Cohost”
On the manage participants tab click “Mute all” and uncheck “Allow participants to unmute themselves”
At this point you have as close to a “presenter up front, audience watching” setup as I could get with zoom. People can watch and listen, but not interrupt. The host can glance at the audience reactions, but they can ignore them if they choose.
If you want to have more social time at the end have the presenter stop sharing (so people can switch back to speaker view or gallery) and
Click Mute all and make sure “Allow participants to unmute themselves” is checked, that will let people jump back into audio
I’ve been doing IaC in AWS for years now, primarily through Cloudformation and scripting languages like powershell and python. IaC is great, but these tools have some short comings like yaml being very verbose, and the powershell AWS SDKs not handling idem potency for you.
Because of those short comings, I was very excited when AWS released AWS CDK a little over a year ago now. It cuts down on a lot of copying and pasting yaml files like you do in cloudformation, and gives you easier access to higher level language constructs like loops and if statements. It also comes with options for strong typing, which lets you get compile time errors instead of deploy time errors (anyone watched a complex cloudformation stack deploy for 30 minutes, only to have a syntax error on the last resource and watch it all role back?)
From a very high level typescript is a superset of javascript, and adds some nice features like strong typing. CDK is a framework and CLI for managing AWS resources.
All of that sounds great, but it can be intimidating to start using a new framework and a new language at the same time. I was new to typescript when I started using CDK, so I figured I’d share some of the tips and tricks I learned along the way. I know CDK supports other languages, but we found that most of the examples are in typescript, so we wanted to stay as mainstream as possible.
Do some reading before you start
AWS is strongly motivated to make it easy for you to get started in CDK. From their perspective the easier it is for you to create resources, the easier it is for you to spend money with them. So before you start hacking away take a few minutes to read some helpful resources like
If you pick one of the serverless examples you can usually stay in the free tier to avoid paying for your learning.
If you’re really trying to avoid spending money use
cdk synth
while you’re experimenting to make sure you can produce a valid cloudformation template without actually creating any resources. This is a good way to test changes and get fast feedback
Get familiar with a few key npm features
I’m not (and don’t really want to be) a nodejs developer, but if you’re working in typescript it will help to know some basic NPM commands like
Use npm install -g aws-cdk to install and update CLI tools like cdk globally. This is very different from…
Using npm install @aws-cdk/aws-ec2 to install packages locally in your project and your package.json file
Use a ^ before your version number to let npm upgrade packages when you run npm install in your project, take the ^ to pin a version. e.g. "@aws-cdk/aws-ec2": "^1.20.0" vs "@aws-cdk/aws-ec2": "1.20.0"
Use npm run build to get errors that might not show up in the output of cdk deploy , but use tsc --build --clean afterwards to remove compiled .js fles — otherwise cdk deploy may not pick up your changes
If you need to downgrade your CDK package version for any reason you can pin the version and then run an npm install to get to an older version
Take advantage of itellisense in VS Code (or your editor of choice)
One of the main advantages of CDK is it’s ability to predict what your typing based on strong types. If you declare types for your objects like
const gateway_nlb_tg:elbv2.NetworkTargetGroup = new elbv2.NetworkTargetGroup....
your editor will be able to offer you methods and their parameters as you’re working
Get ready to be active in the CDK open source community
You’re using a pretty new open source project, and your best bet for help when you run into issues (in my experience) is to open an issue in the github project.
Keep in mind you’re not opening a support ticket with a vendor, so you need to bring all of the information you can to help some else help you solve your problem (e.g. the versions of CDK and packages you’re using, what you expected to happen, the errors you got, etc).
As long as you open an issue with a reasonable amount of information the community is very willing to help.
Conclusion
Those are the tips I wish I’d known when I started using CDK. Best of luck!
This is a topic I’ve been curious about for a long time. My team supports windows and linux environments which presents some unique challenges
We have to move in and out of shell environments
We have to understand tools on both systems (grep vs find, etc)
We have to understand nuances of running languages on multiple OSs (pathing is always a joy)
The company mostly issues Windows laptops (and some Macs), so we’ve used a number of different approaches to get run time in both environments including
Local VMs running on our laptops
VMs running in a VMWare cluster
Straight EC2 instances
Cloud9
Docker containers
WSL
They all have pros and cons, but I’ve been curious about Remote Development with VS Code for a while so I gave it a try to see if it could make sense to add to the list.
I’m working on a Windows 10 laptop with Docker Desktop installed. I found this article and started running through it.
No problems on install. It creates a new side bar icon for remote options and some helpful info about the containers you have available. It also shows you the container’s volume mount, which is helpful context.
I cloned the node example repo, and the popup in the article came up no problem, and within seconds I was debugging a node process. Not bad.
Now with PowerShell
As usual, I gotta tie it back to PowerShell. My team does a lot of development in PowerShell, and we’re starting to do some PowerShell Core development targeted at Linux. This feels like it could be a good fit.
I created an empty directory with a .devcontainer directory
The I mimicked the devcontainer.json file from the node sample repo
{
    "name": "PS Sample",
    "dockerFile": "Dockerfile",

    "settings": {
        "terminal.integrated.shell.linux": "/bin/bash" // Hoping to switch to pwsh later
    }
}
And then created a one line docker file
FROM mcr.microsoft.com/powershell
When I clicked on the remotes icon a popup offered to reopen the folder inside my dev container. I let it build and it dropped me right into a bash window
So I added a hello world powershell script through VS Code
write-host "hello world!";
Like I expected the file showed up inside of the container and I could run it with pwsh HelloWorld.ps1
Debugging PowerShell
Next I wanted to debug my powershell script. At first I was disappointed because it looked like the extension wouldn’t pick that up by default
But I found this article on debugging inside of a dev container and it had a helpful link to this extension.
I struggled with it for a few minutes before realizing the VS Code was seeing the extension already installed on my local machine, but not in my dev container. I added that to the extension list in my devcontainer.json file like so
Rebuilt the container, and just like that debugging showed up!
Lastly, adding this to an existing project was just a matter of copying over the .devcontainers folder (I won’t show any screen shots, because it’s an active project).
I will note the powershell modules are a sub section of a larger project that includes work in other languages (typescript, python, etc). I had to put the .devcontainer directory in the root of the powershell section of the project.
Conclusion
There is a little magic happening here, like installing support for VS Code extensions inside of the container. But for the most part it’s pretty standard Docker features like volume mapping, interactive terminals, etc. Just grouped together for convenience.
Remote development will go into our list of tools for spending time in other languages!
If you’re a frequent user of the AWS Powershell tools, you’ve probably had this experience: you go to run a couple commands against your AWS environment. You do it all the time, so you know to type
Get-EC2Instance -InstanceId i-1111111111
But out of force of habit you type
Get-Ec2inst
And hit the tab key. Now you’re sitting and waiting for several minutes while Powershell loads all of the AWS modules for IAM, ECS, Cloudfront, S3, etc, etc, etc, even though you only want to interact with EC2. A few minutes later it’s done, and you start typing again
Get-EC2Instance -ins
And without thinking you hit the tab key again, and wait for another few minutes while Powershell loads parameter completion.
Well, AWS recently released AWS.Tools for Powershell. It’s a modularized version of the AWS Powershell tools that promises better load times because you can pick and choose the modules for AWS services that you want. Like most of you, I’m hesitant to try anything new fangled on my main laptop right away. Your boss probably likes hearing, “I can’t help with that issue right now, I broke my management environment” as much as mine does.
So I figured I’d try installing the tools in a docker container first. My current windows 10 version is 1803, so I’ll be using
mcr.microsoft.com/windows/servercore:1803
(Yes, I know server nano is smaller. Yes, I know you can run AWS.Tools on linux with .NET Core. I use a windows laptop, so I’d like to see AWS.Tools running in as close to my laptop as I can get)
docker run -it -v "$($home)/.aws:c:\users\containeradministrator\.aws" mcr.microsoft.com/windows/servercore:1803 powershell
The -v is to map my AWS credentials into the container to use after I install AWS.Tools
Next, following the install instructions here I run
Install-Module -Name AWS.Tools.Installer
I had to accept a new NuGet provider when prompted
NuGet provider is required to continue
PowerShellGet requires NuGet provider version '2.8.5.201' or newer to interact with NuGet-based repositories. The NuGet provider must be available in 'C:\Program
Files\PackageManagement\ProviderAssemblies' or 'C:\Users\ContainerAdministrator\AppData\Local\PackageManagement\ProviderAssemblies'. You can also install the NuGet provider by running
'Install-PackageProvider -Name NuGet -MinimumVersion 2.8.5.201 -Force'. Do you want PowerShellGet to install and import the NuGet provider now?
[Y] Yes  [N] No  [S] Suspend  [?] Help (default is "Y"): Y
And then accept that AWS is technically an untrusted repository
Untrusted repository
You are installing the modules from an untrusted repository. If you trust this repository, change its InstallationPolicy value by running the Set-PSRepository cmdlet. Are you sure you want to
install the modules from 'PSGallery'?
[Y] Yes  [A] Yes to All  [N] No  [L] No to All  [S] Suspend  [?] Help (default is "N"): Y
Easy enough! Next I tried to use the build in installer function that handles dependencies for you. I’ll start with just the EC2 module for simplicity
Install-AWSToolsModule AWS.Tools.EC2
This command sat for quite a while for me, but when it was done I couldn’t import or use the modle
PS C:\> get-ec2instance
get-ec2instance : The term 'get-ec2instance' is not recognized
I haven’t taken the time to troubleshoot this, but it seems like the documentation promises to install to $env:ProgramFiles\Powershell\Modules when the container has $env:ProgramFiles\WindowsPowershell\modules
At any rate, let’s try just grabbing the modules ourselves instead of letting AWS abstract it away.
I ran these commands to grab the common module (used by all the AWS.Tools modules) and the EC2 module directly
Now that I’ve got it working, I removed all of the modules from my session with
Remove-module AWS*
So I can compare importing the module versions to the monolithic tools on my laptop. I’ll use this command in both environments to see how long it takes to load the modules, and query EC2 for the results:
Under a second! Let’s try that with the old AWSPowershellTools back on my laptop (which loads all of the AWS powershell modules when you call any command)
It’s been a while since AWS released support for running Powershell in Lambda Functions. Up until now all of the Lambda functions I’ve worked with have been either python or NodeJS, but we recently had a project that needed to update a database from inside of a deployment pipeline.
We’re trying to retire an old admin box where users would run Powershell management scripts to do things like provision servers, configure customer accounts, etc. Rather than trust a user to remember which script to run, pick the right parameters, check the output, etc, etc, we wanted all of that to happen as part of a CICD pipeline.
I know what you’re thinking: “Why would you drag along the powershell scripts? It’s probably a zillion line single script that’s impossible to debug or manage.” But the codebase is pretty well designed — it’s modular, implements defensive programming, has tons of business logic in it, and most of it has >50% unit test coverage with Pester. So there’s a lot of good stuff there that would take time to rebuild in another language.
So what’s our plan?
Our goals are to have a Lambda function that runs some .NET Core powershell code. The code needs have unit tests that can be run in a CI environment, and be deployed from a pipeline.
The .NET core requirement is interesting. As a windows user I’m still on Powershell 5.1 on my laptop and I use AWSPowershellTools (the old monolithic Powershell module). That’s not to say I couldn’t make the jump, but I’d rather not risk breaking my other tooling for this one project. So we’ll setup a docker environment to do our local development. Let’s get started!
It’s probably obvious, but I’ll be assuming you’re working on a windows machine.
Setting up a Docker image for the build
The first thing we need is a docker image we can use to run our local builds and deploys in.
My first instinct was to use an image from the Powershell repo, but I had a terrible time getting the right version of .NET Core installed. I was getting errors running the Powershell commandlets for building the lambda functions, .NET core install errors, and the list went on.
After struggling for a while I flipped to the mcr.microsoft.com/dotnet/core/sdk run time, and it worked much better. After reading several of the tutorials I decided to use the 2.1-bionic tag because
Lambda functions are going to run in a linux environment
It’s smaller than running a windows container
it worked! 🙂
The first step is to get into the container and see what tools we’ll need. So I ran
mcr.microsoft.com/dotnet/core/sdk:3.1-bionic
And of course because this is a linux container our interpreter is bash off the bad. Installing powershell is pretty easy
dotnet tool install --global PowerShell
That gives us the pwsh program we can use to get into Powershell on the linux container. To see this running try
export PATH="$PATH:/root/.dotnet/tools"
pwsh
gci # prints your current directory
exit # returns you to bash
Next we need to install the zip package.
apt-get update \
&& apt-get install zip -y
This will take several minutes while your container downloads You can run these as separate commands too if you’d like. When you see the AWS CLI print it’s version you know you’re setup!
Let’s we need to install the AWSLambdaPSCore into the Powershell environment. To do that you’ll run
You can break that apart too if you want to. As long as you don’t see an error importing the Powershell Module you should be good to go! Let’s put all of that work into a docker file
This tells powershell to create a new module definition, points to the Common.psm1 powershell module, and exports all functions. You can get a lot fancier with your psd1 files, but those are the basics to get started.
Next we’ll create a simple function in our common module
# Function to insert some data
function Set-AppData {
    write-host "working on inserting data";
    return $true;
}
Export-ModuleMEmber -function 'Set-AppData';
And add a single unit test for it in a tests\Common.tests.ps1 file
# Test all of the citrix common functions
Describe "Common Functions tests" {
    InModuleScope Common {
        It "returns true" {
            Set-AppData | Should be $true;
        }
    }
}
# Cleanup the module so we can test new changes
remove-module Common;
The boiler plate code the top lets you execute your tests from either the CommonModules directory or the CommonModules\tests directory. We should be able to invoke this and see our tests pass
Powershell Handler
Our Powershell handler is going to be hard to be a little hard to unit test. It seems like it has to be a ps1 file, and AWS Lambda is going to run the script from top to bottom. That makes it a little hard to inject unit tests if we have a lot of logic in that handler script.
That’s why we’re keeping our handler thin (and using the common modules we created above. Let’s look at a slim implementation of the Lambda Handler
# PowerShell script file to be executed as a AWS Lambda function.
# When executing in Lambda the following variables will be predefined.
#   $LambdaInput - A PSObject that contains the Lambda function input data.
#   $LambdaContext - An Amazon.Lambda.Core.ILambdaContext object that contains information about the currently running Lambda environment.
# The last item in the PowerShell pipeline will be returned as the result of the Lambda function.
# To include PowerShell modules with your Lambda function, like the AWSPowerShell.NetCore module, add a "#Requires" statemen
# indicating the module and version.
#Requires -Modules @{ModuleName='AWSPowerShell.NetCore';ModuleVersion='3.3.335.0'},@{ModuleName='Common';ModuleVersion='0.0.1'}
write-host "Inserting new app data"
Import-Module Common;
# Use function from CommonModules to insert new CMT app workers
Set-AppData;
The end of this script looks like pretty standard powershell, we import a module and call a function.
The top of the script is comments which get generated when you call New-AWSPowerShelLambda .
The middle of this script is interesting, though.
#Requires -Modules @{ModuleName='AWSPowerShell.NetCore';ModuleVersion='3.3.335.0'},@{ModuleName='Common';ModuleVersion='0.0.1'}
write-host "Inserting new app data"
Import-Module Common;
This line tells the AWS tools how to pull together the modules that your function requires. And here’s where we hit an interesting part of our build: we need a place for the lambda tools to find both your modules, and the AWSPowerShell.NetCore module.
Walking through the build
This script will run inside of the container. We’ll start by creating a new temp directory, and registering it as a local powershell repo.
That’s the build, lastly let’s pull it all together with a docker-compose file.
Docker Compose File
Docker compose is a tool for building and running multiple services at a time in a docker development environment. Among other things it lets you call out volumes to map into your container, which is our main use.
Our goal is to map the powershell script, modules, and our AWS credentials into the container so we can run the build using the .NET Core container.
This post is going to have fewer technical examples and be more about my troubleshooting methodology. The concepts I’m going to describe may seem rudimentary to some, intuitive to others, and eye opening to a few. I’ve watched enough junior engineers wrestle with solving vague problems I felt it was worth documenting my approach.
When you’re a junior developer or a computer science it’s easy to get used curated problems — that is bugs or issues that are scoped for you and may come with some guidance toward a solution. We’ve all gotten assignments like, “Use Dijkstra’s algorithm too….”, “User Jim Bob is having trouble printing, please call him and have him update his print driver”, “When you get this page in the middle of the night follow this troubleshooting document to restart x job.”
Don’t get me wrong, this problems can still be frustrating and can take a lot of work to resolve. Dijkstra’s algorithm is not simple, and walking a user through updating a print driver over the phone is something I still have nightmares about. But those problems give you a starting point like which algorithm to use, looking at a print driver, or following a document. I classify those problems differently than what I think of as “vague issues”.
Vague issues are problems that don’t come with any guidance, and don’t scope themselves for you. Thinks like, “This application is acting slow”, or “we’re getting consistent reports of an error we can’t seem to reproduce”, or “a lot of users are different locations are complaining they can’t print”. Problems like these don’t have any scope for you, they don’t have a documented solution, and they aren’t solved easily. As a DevOps practitioner I’ve seen these problems both with my development hat, and my Ops hat on. The specific tools you use with each are different, but my general approach is the same. I’ll give an example of each.
The steps to my routine are
Grasp the severity of the problem
Pick wide, useful outer bounds for the broken system
Divide the system into components based on your insight points
Assess the insight point closest to the middle of the system and decide if the problem is closer to the symptom, or closer to the back end
Shrink the system based on your decision, picking new components if it makes sense
Repeat until you are confident you’ve found the problem
Let’s dive in!
Grasp the severity of the problem
All troubleshooting and debugging is done on a mix of qualitative and quantitative data. By that I mean every time you solve a problem you are working with a mix of numbers (“The API is generating 50% 500 errors”, “90% of print jobs are never printing”) and feelings (“Users are furious, support is overwhelmed!”, “The app is so much slower than it was earlier today I can hardly use it!”). In most cases qualitative data is much easier to get on the fly.
Because you’ll often be working with qualitative data you’ll want to take a temperature on the people giving it to you before you dive in. A small problem can be presented as a world ending event if an important customer calls in. Ask questions that push users to pull quantitative data out of the anecdotes they’re telling you like
How many users have called in?
How long ago did this start?
Are the users all from one location or several?
And some questions that help you understand the emotional state of the person answering the questions
How serious do you feel this problem is?
How frustrated are the users?
This a soft skill interaction rather than a technical one, but it will help you understand how much time the person reporting the problem has spent working on it, and how calmly they are relaying what they’ve learned.
This is also a good time to decide if the problem is a “drop everything now” type of issue, or a “I’ll put this on my todo list for next week”
Pick wide, useful outer bounds for the broken system
This is your change to brain storm everything that could be related to the problem. Here are a few examples I’ve done recently
A page of our application is reported as being slow
The outer bounds for the system are the users web browser (they might be using an old or poor performing machine) all the way back to the disk drives on the database the page connects to.
Users at our corporate office couldn’t get to the internet
The outer bounds are the users themselves (I can’t rule out that a user is typing in a wrong web address), all the way to our ISP hand off (I trust that if the ISP had a problem I would’ve seen an email).
A few general rules for picking your outer bounds when you’re having a problem
If you can’t confidently rule out that a component is contributing to the problem then include it in the system
Check your confidence level on every component. Classify your knowledge into “I thinks” and “I knows”
Divide the system into components based on your insight points
Any technology system is made up of dozens, possibly hundreds of components. You could think about a bug in terms of bits and bytes, but it’s not helpful. Instead divide the system on your insight points, or places you can gather logs or metrics, or inject an active test.
For our slow web page example the components are
The load balancer that routes traffic to the web server — I can see load balancer metrics
The SSL off loader that decrypts and re-encrypts the traffic for inspection — this is in nginx and we can see logs for timeouts
The IPS/IDS device that does layer 7 inspection on the app — I can see if a rule suddenly started going off
A downstream API that handles a synchronous call — I can see request completion times in the logs
The disk drives the webserver writes logs to — I can see read/write latencies
The database the application queries — I can have a DBA pull query plans and check for row locks
The disk drives the database uses to store data — I can see read/write latencies
For users are our corporate office not being able to access the internet the insight points are
The DHCP server that hands out IP addresses to clients — I can inject an active test by renewing my laptop’s DHCP address
The DNS server that resolves hostnames to IPs for our office — I can do an nslookup for an active test, or look at DNS caches
The core switches that route traffic to our ISP — I can look at switch logs or traffic statistics on a port
The firewall we use to allow traffic outbound — I can look at firewall CPU or logs
Our ISP who handles the traffic outside of our building — I can use a vendor portal to check traffic stats, or call them to find out if there is a regional problem
Assess the insight point closest to the middle of the system and decide if the problem is closer to the symptom, or closer to the back end
The idea here is that you are doing a binary search for the source of the problem. Looking in the middle of the system can tell which direction to move in.
Keep in mind the hardest problems to diagnose are the ones without a single root cause. Problems with two or three small contributors. While you’re troubleshooting keep an open mind, and don’t dismiss a problem because it isn’t the only source.
For our slow web page example
In this instance I would start on the web server, and look at request counts and latencies. If I see a smaller number of requests, it’s likely the problem is before the traffic hits my app server, and it could be an inbound IPS/IDS, SSL off load, load balancer, or even the internet connection into my data center.
If I see normal numbers of requests with high latency, I’ll move backwards towards the disks where the logs are stored, or the database itself.
For users are our corporate office not being able to access the internet
I start with a user’s machine and see if they are getting a DHCP address. If they are, can they resolve DNS entries? Can they print their next hop on the way to the internet? If they can, the problem is closer to the internet. If they can’t, the problem is closer to the user’s laptop, like a DHCP server or a DNS server being down.
Shrink the system based on your decision, picking new components if it makes sense
At this point in either scenario you’ve shrunk your problem domain pretty well, which is great! You have fewer things to look at, and you’re probably moving in the right direction.
Important things to remember at this stage are
Don’t shrink your problem domain quickly. Use what you’ve observed to pull in a little closer without skipping components you haven’t examined yet
Reference what you’ve seen, but watch for your own bias. When you’re troubleshooting, it’s easy to blame something you don’t understand. Always question assumptions about pieces you feel you own
Be expedient, but deliberate. When you’re working on a problem and people are hounding you for an ETA on a fix, it’s easy to get agitated. Don’t let urgency rush quality troubleshooting. It can make a problem drag out if you get spooked and move too quickly.
Repeat until you are confident you’ve found the problem
Rinse and repeat these steps! You’re recursively looking for a solution. There is no substitute for steady, consistent, calm troubleshooting. Wild guesses based on not enough information can muddy the waters.
Conclusion
Troubleshooting and debugging are hard. Most engineers, whether software engineers or IT engineers, would rather create something from scratch. But there is a lot of value in being able to take a system you aren’t familiar with, break apart it’s components, and start digging into it’s core functions and problems.)
AWS uses a “pay as you go” model for most of it’s services. You can start using them at any time, you often get a runway of free usage to get up to speed on the service, then they charge you for what you use. No contract negotiations, no figuring out bulk discounts, and you don’t have to provision for max capacity.
This model is a double edge sword. It’s great when you’re
First getting started
Working with a predictable workload
Working with a modern technology stack (i.e. most of your resources are stateless and can be ephemeral
But it has some challenges when
Your workload is unpredictable
Your stack is not stateless (i.e. you have to provision for max capacity)
Your environment is complex with a lot of services being used by different teams
It’s easy to have your AWS costs run away from you and you can suddenly find yourself paying much more than you need or want to. We recently found ourselves in that scenario. Obviously I can’t show you our actual account costs, but I’ll walk you through the process we used to start digging into (and reducing our costs) with one of my personal accounts.
Step 1: AWS Cost Explorer
Cost Explorer is your first stop for understanding your AWS bill. You’ll navigate to your AWS Billing Dashboard, and then launch cost explorer. If you haven’t been in cost explorer it doesn’t hurt to look at some of the alerts on the home page, but the real interesting data is in Costs and Usage
My preference is to switch to “stack view”
I find this helps to view your costs in context. If you’re looking to cut costs the obvious place to start is the server that takes up the largest section of the bar. For this account it’s ElastiCache
ElastiCache is pretty straight forward to cut costs for – you either cut your nodes or node size – so let’s pick a more interesting service like S3.
Once you’ve picked a service to try to cut costs for add a service filter on the right hand side, and group by service type
Right away we can see that most of our costs are TimedStorage-ByteHrs which translates to S3 Standard Storage, so we’ll focus our cost savings on that storage class.
Next we’ll go to Cloudwatch to see where our storage in this class is. Open up Cloudwatch, open up metrics, and select S3.
Inside of S3 click on Storage Metrics and search for “StandardStorage” and select all buckets.
Then change your time window to something pretty long (say, 6 months) and your view type to Number
This will give you a view of specific buckets and how much they’re storage. You can quickly skim through to find the buckets storing the most data.
Once you have your largest storage points you can clean them up or apply s3 lifecycle policies to transition them to cheaper storage classes.
After you’re done with your largest cost areas, you rinse and repeat on other services.
This is a good exercise to do regularly. Even if you have good discipline around cleaning up old AWS resources costs can still crop up.
A quick AWS Powershell tools snippet post here. When you call Get-EC2Instance from the AWS Powershell tools it returns an instance object that has a Tags attribute, which is a Powershell list of EC2 Tag Objects.
I’m usually a fan of how the AWS Powershell Tools object models are setup, but this is one case where I feel there could be some improvement. Instead of using a list and forcing users to iterate the list to find the right tag, the EC2 objects “Tags” property should be a hashtable with the tag Key as the hash key so you can index directly to the object. But, this is was we have to work with for now.
So we came up with a simple function to generate a map of desired EC2 tags from an instance.
One of the most frustrating things in network troubleshooting can be finding out if traffic is being blocked. Blocked traffic can keep applications or a services from running correctly. A lot of applications will throw unhelpful or vague error messages.
Until relatively recently the average network was a pretty open and trusting place. Most computers were allowed to receive and send traffic on any port they pleased, any protocol was allowed to use any port with no explanation required.
But with ideas like network segmentation becoming more prevalent, and tools like AWS security groups essentially wrapping each server in a tiny firewall, those ideas are changing. It’s much more common for firewall and security admins to white list traffic and only allow the ports and services explicitly asked for.
My goal with this post is to get you focus a packet capture to find this blocked traffic, which can be very helpful for your network or firewall admins by relieving headaches, reducing stress, and getting you up and running faster. I’m assuming you’re somewhat familiar with TCP and Wireshark.
This brings us to a really helpful aspect of the TCP 3 way handshake: it’s relatively easy to find TCP conversations that never leave the initial state, which usually means that traffic is being blocked.
Let’s look at a healthy example to get some context.
I marked off the TCP flags because that’s the piece we’re interested in. This is an example of my laptop reaching out to a web server on port 443. The three packets follow the standard TCP handshake
My laptop sends a SYN (“Hi, I’m a client and I’d like to connect.”)
The server sends a SYN,ACK (“Hi, I’m a server and I’d like to connect to.”)
My laptop sends an ACK (“Sounds good. Let’s be friends!”)
NOTE: The parentheticals are paraphrased for comedic effect.
How does this help us find blocked traffic? Well we can use a Wireshark analysis to look for conversations the client is trying to start that never get answered.
When a typical application sends a SYN packet out, but never receives a SYN,ACK back from the server it will retry the SYN packet several times, hoping to get a connection. Because the application is trying the same thing over and over again we can use a wireshark analysis that finds retransmitted packets:
tcp.analysis.retransmission
I’ll use start a wireshark packet capture on my wireless adapter and use a powershell command to initiate traffic to a port on the internet I know won’t respond, say 4433 on google.com:
And then apply a filter in wireshark to look for retransmitted packets to this port, and they jump right out!
If this were a real application I was trying to fix, and not just a toy example I’d be able to go to my network admin and tell them that I see traffic leaving my server outbound for the IP and port in the capture.
In this toy example I was able to be very specific, but in real life you might not know port your application is trying to communicate on. In this scenarios you might wind up capturing a lot of traffic pretty fast. For example when I started this paragraph I turned on a packet capture with no filters and in the time it took me to type this I caught around 500 packets just from background activity on my laptop!
That can quickly turn into a lot of traffic to sort through, so we can add a Wireshark filter to look only for SYN retransmits.